Today, NextFaze is releasing our new Angular debugging tool DevMod to npm. It’s a debugging and developer module that gives a floating button which summons a special developer interface. At the moment, this interface allows you to:
-
Call functions on components in the DOM,
-
Track the recent emissions of observables and
-
Throw an error to check your application’s error handling
We’ve been using it internally for a while and we loved it so much we just had to open source it for the community.
DevMod’s core functionality — the @DeveloperFunction decorator — is based on a similar NextFaze debugging tool published for Android apps: DevFun.
We use tools like Augury a lot for debugging — which we love — but the idea of being able to call any component method from a special interface really tickled us. The use cases cropped up all the time for things like automatically filling in forms with valid data to test core user flows or magically logging in as a particular user type during development.
In this post, I wanted to go into detail on how the tool is built and the various debugging tools that Angular gives you out of the box, including ng.probe, that make it possible for debugging tools like DevMod and Augury to analyse your app.
 for the image.](https://cdn-images-1.medium.com/max/2000/1*51GPdzcrBrhMH-gnjGsKcw.jpeg) “I heard you had something that needed probing…” — Thanks to pixabay for the image.
“I heard you had something that needed probing…” — Thanks to pixabay for the image.
Development Mode vs Production Mode
We’ve all seen the little warning that Angular gives you in the console when running in development mode. It tells you to call enableProdMode() before deploying the app in production. So what exactly does calling this function do? Or, more importantly, what happens when it’s not called?
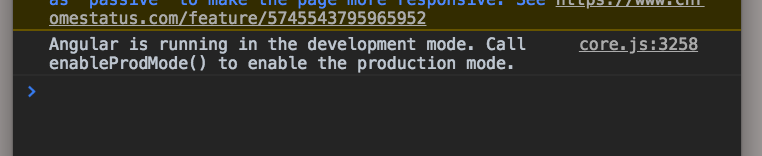 Angular’s development mode warning
Running in development mode actually does a few things under the hood. It is what gives you more verbose stack traces and adds lot of the Angular specific properties to the DOM to aid in debugging. However, what we’re interested in are two globally available variables that are also exposed in development mode: the getAllAngularRootElements function, and the ng object.
The getAllAngularRootElements function does pretty much what it says on the tin. You call it and it returns an array of all Angular app root elements on the page. Typically this just contains one element — your own app’s root.
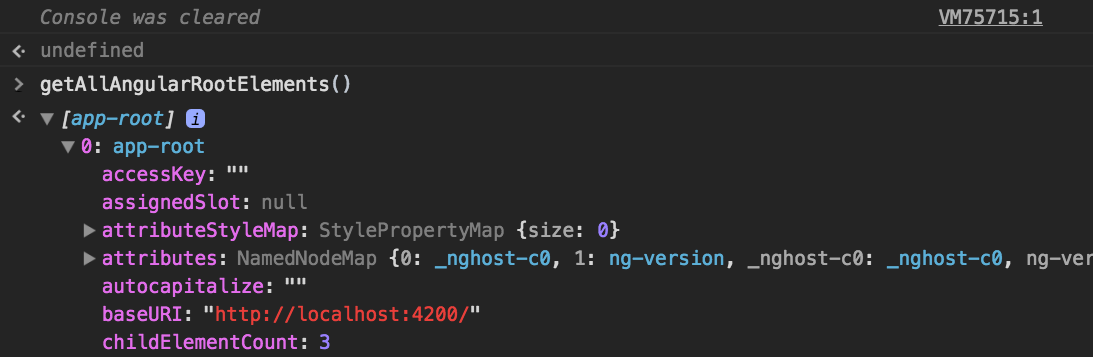 The output of
 getAllAngularRootElements() in a default Angular CLI app running in development mode.
The ng object is slightly more interesting. It contains two properties: an object called coreTokens — which contains three injection tokens we can use: ApplicationRef, NgZone and Router — and a probe function. The probe function can be passed any DOM element on the page and it will return a DebugElement instance wrapping the particular node. If you’ve done any Karma testing you’ll be somewhat familiar with DebugElements. They contain the nativeElement instance as well as some other Angular debugging goodies. In the case of a component element, it also contains a reference to the componentInstance.
You can try poking around your application yourself. Chrome provides a $0 variable containing the currently selected node in the element explorer, so you can select a component element in your app and get to the actual component instance using ng.probe($0) to get the DebugElement and ng.probe($0).componentInstance to get the actual Angular component instance.
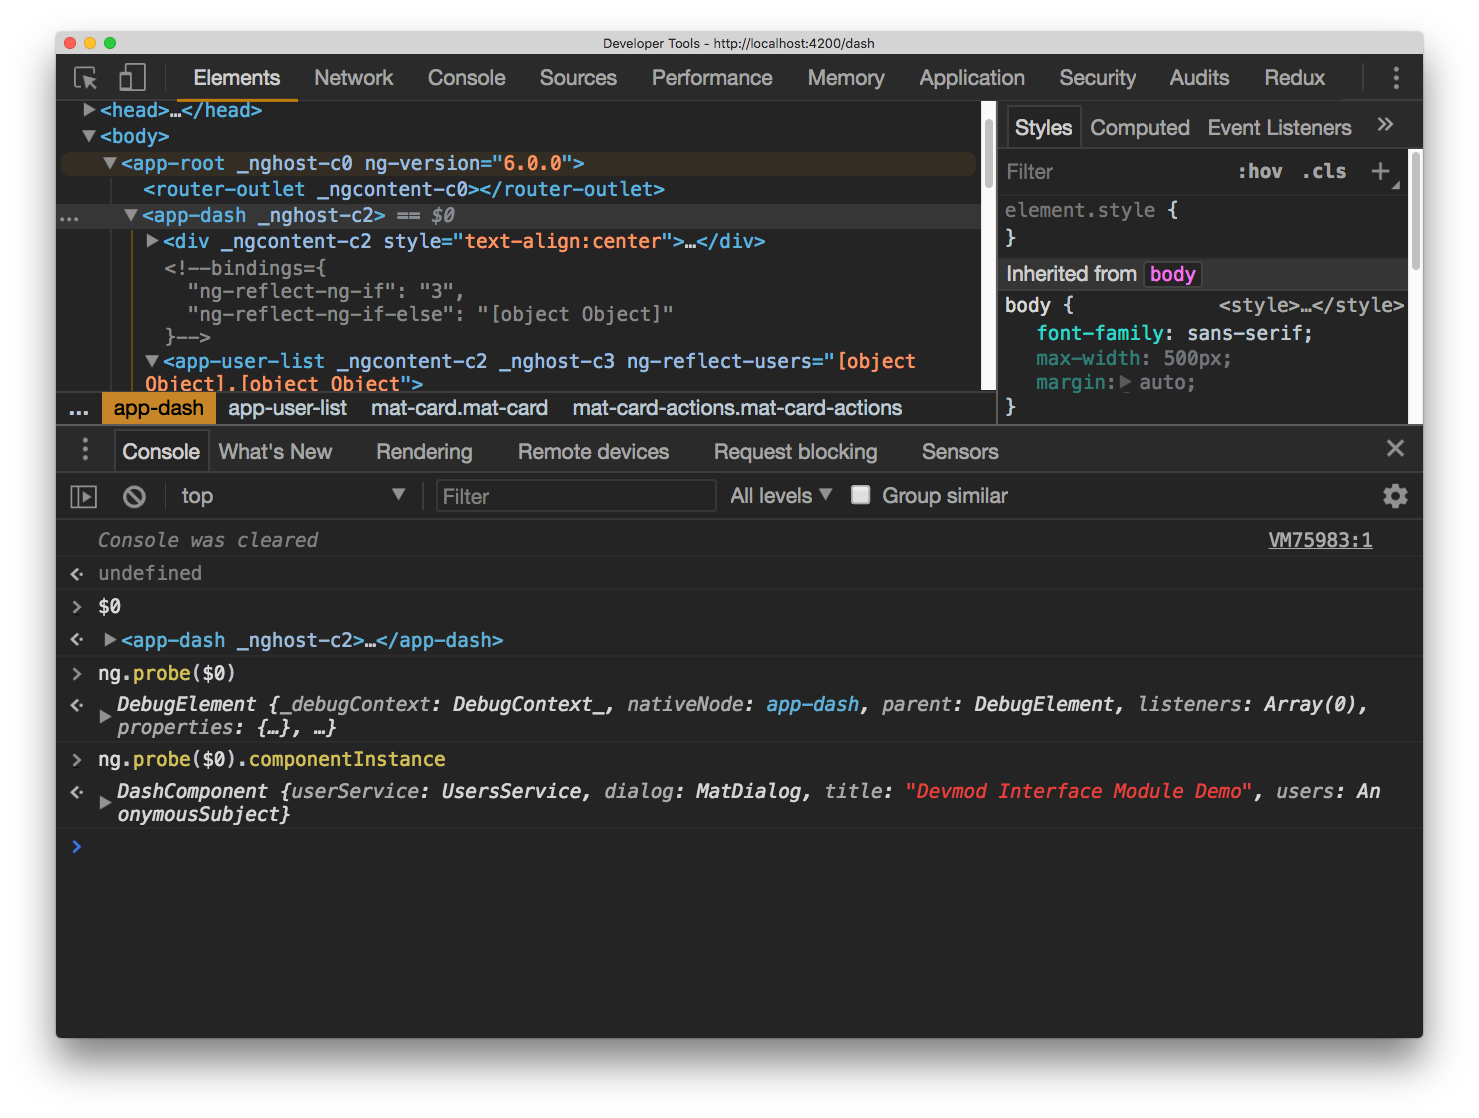 Getting the DashComponent instance from a DOM element using
 ng.probe
As an aside, it’s actually a neat trick to jump to the actual file that defines your component by probing the element for the component instance and using Chrome’s inspect function (which, when called on a function, jumps to that function’s definition in the respective JavaScript file) to jump to the constructor.
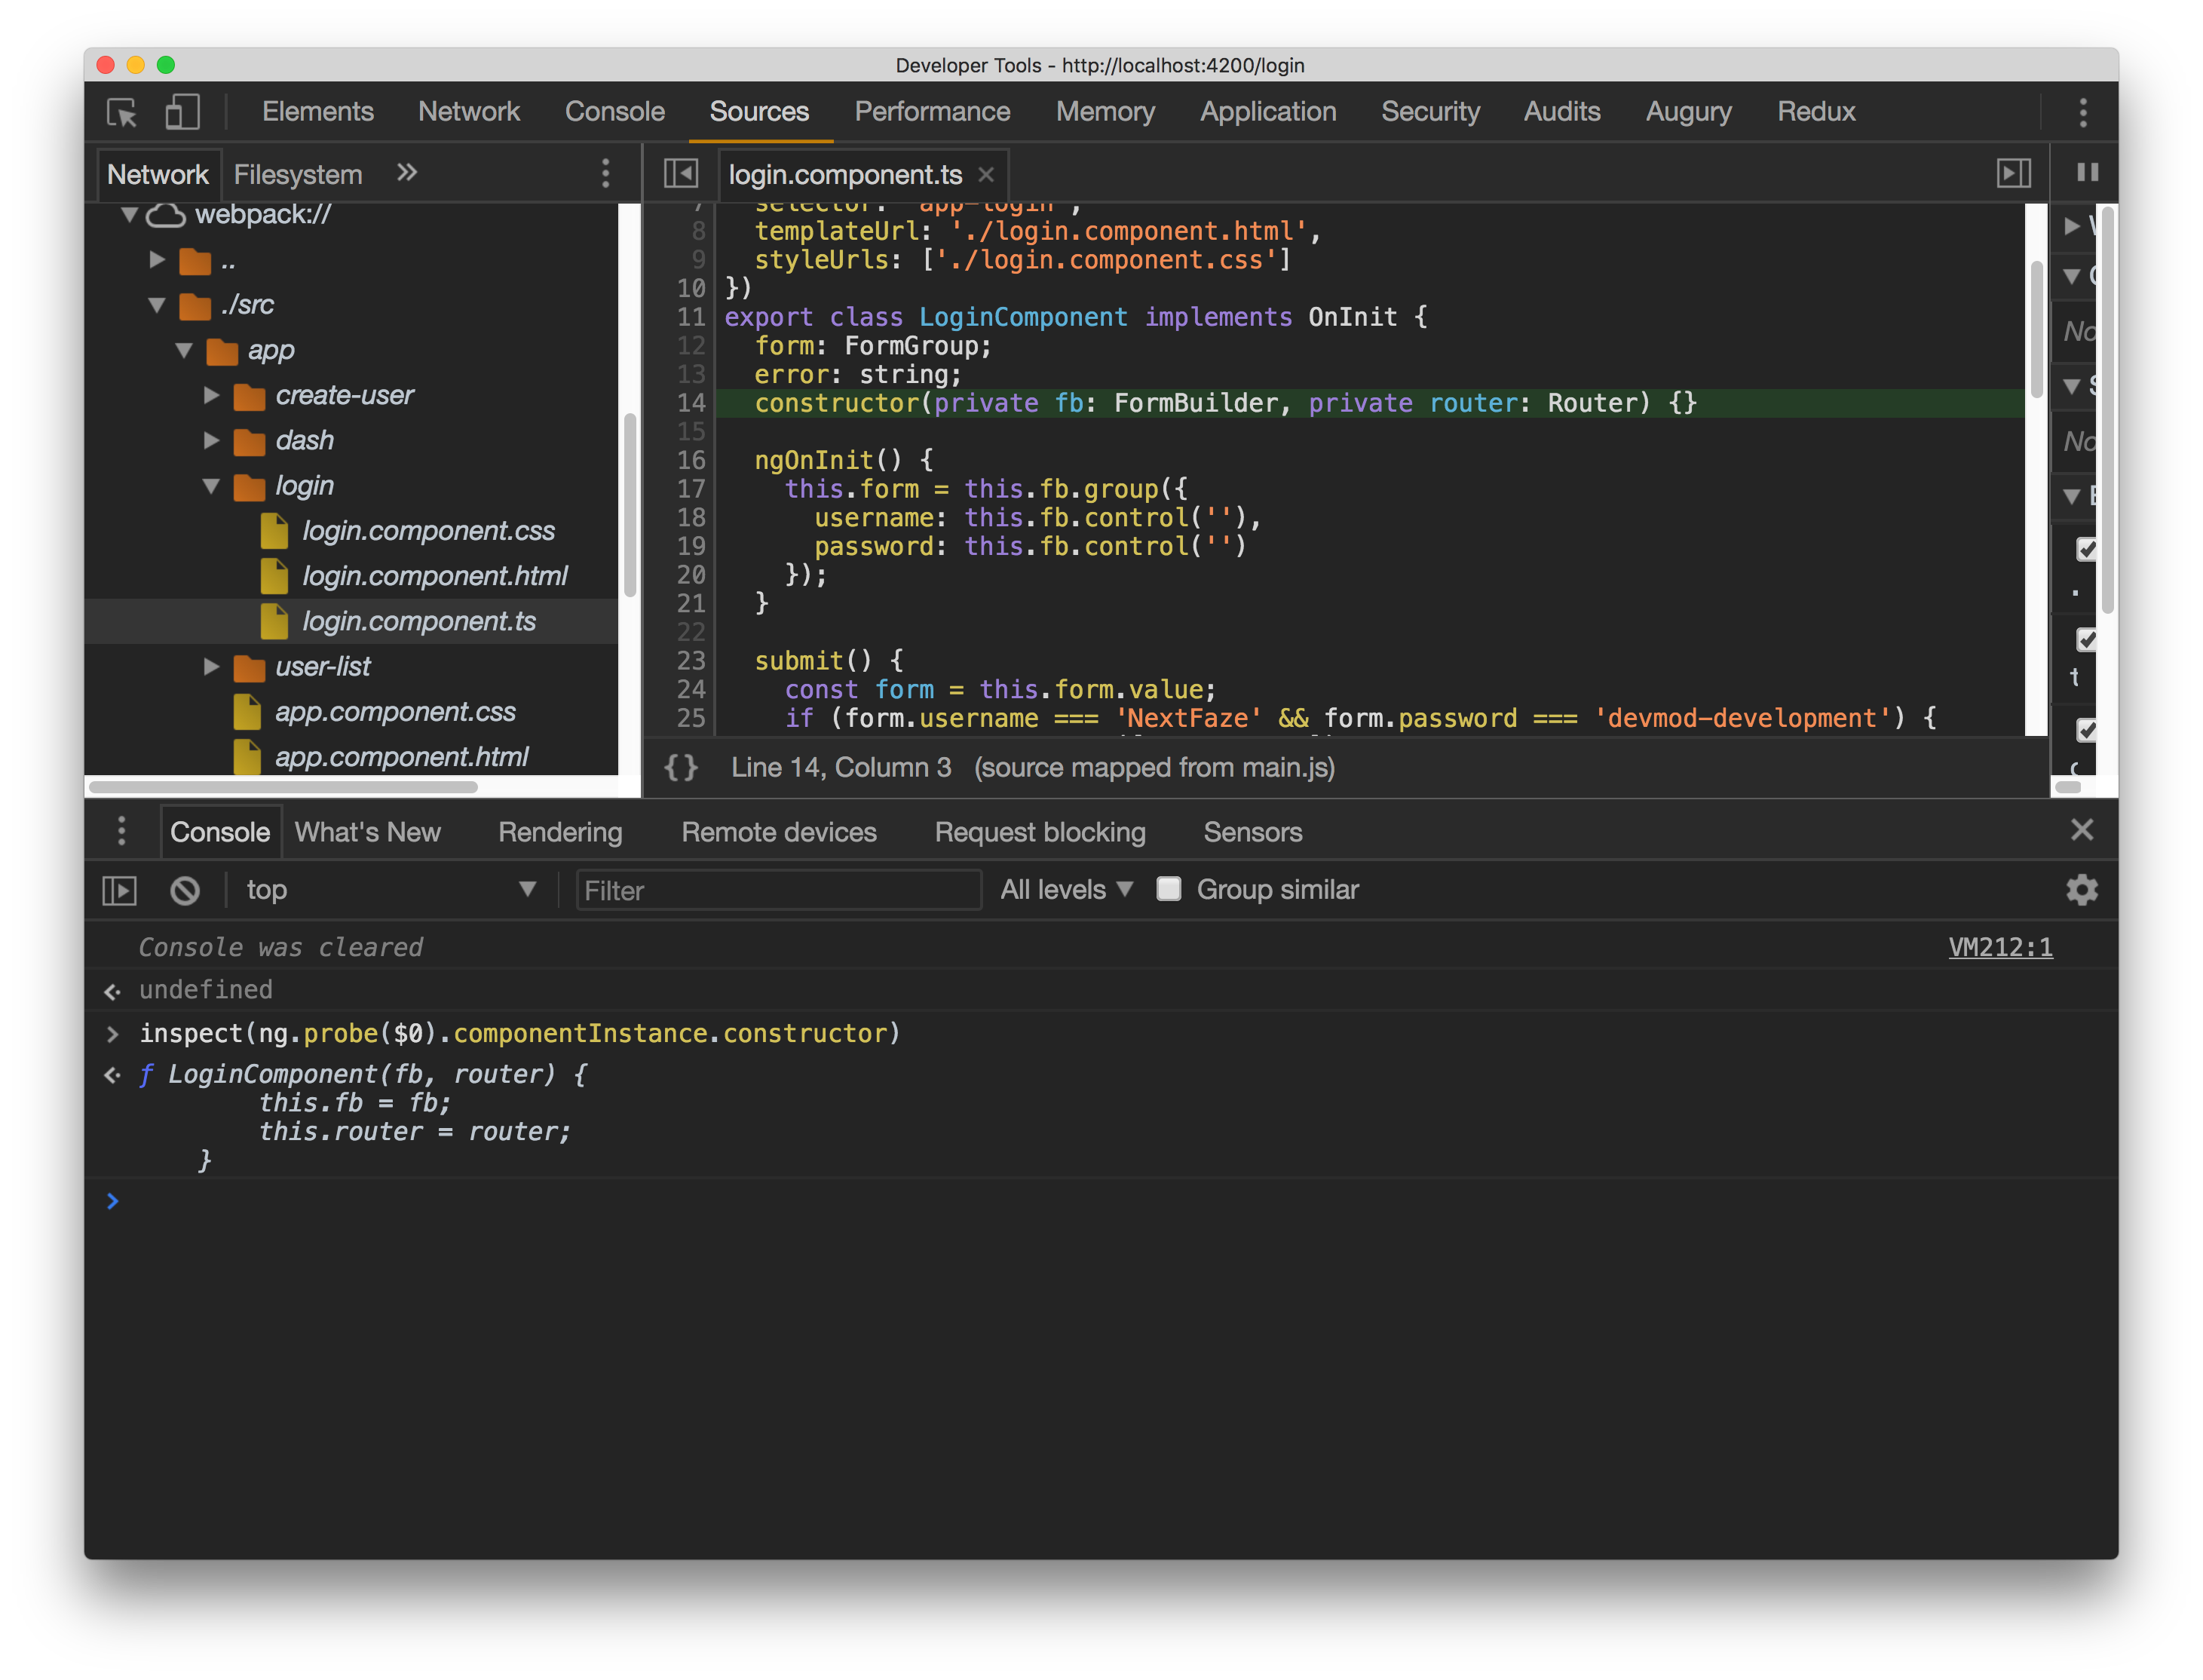 Jumping to the login.component.ts file by probing our login-component element and inspecting the constructor.
Building up a picture of the app
The combination of these two global functions, along with the core injection tokens, are the foundation of how debugging tools like Augury and DevMod analyse your app. If we have the application, we can get to the injector, and if we have the injector, we can pretty much pull anything we want out of the app, including the app module itself, along with all of the decorator information passed into it.
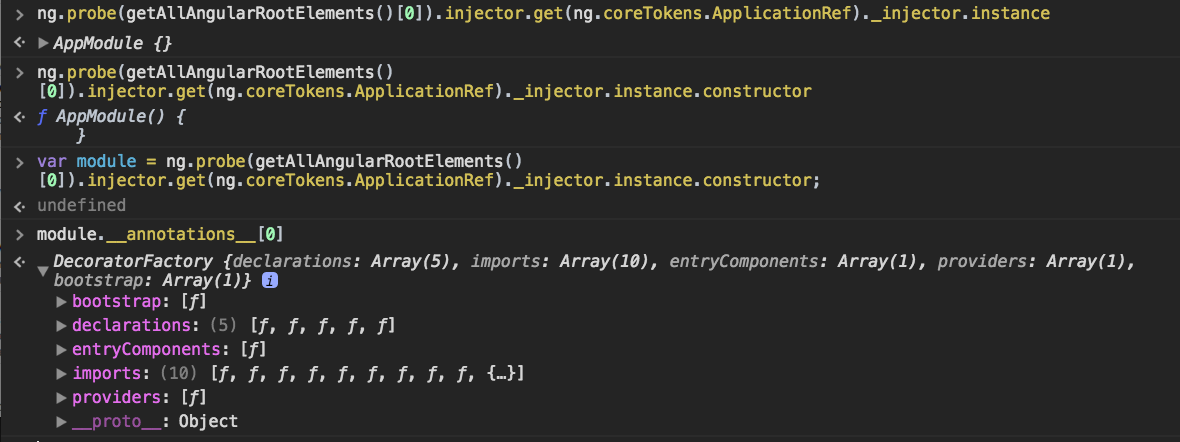 Expanded versions of the functions used to get to the app module decorators in DevMod. We now have a list of all component declarations, entry components, providers and external module imports available.
From here, we’re just a recursive function away from building a complete tree of your app, all its module dependencies and all of their components and providers. This is exactly what Augury provides and the way it does it under the hood is similar to the way outlined above.
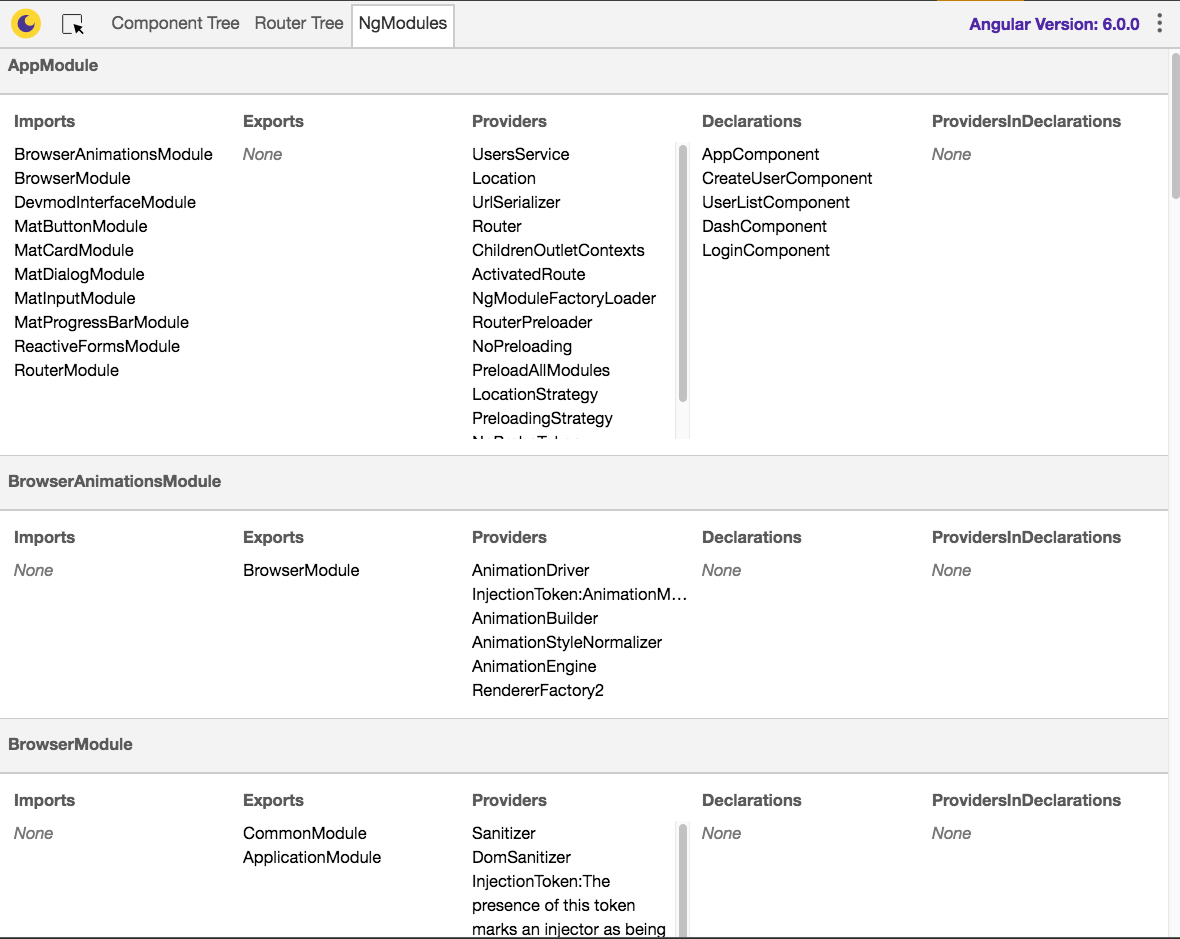 Augury showing all imports, providers and declarations in an application, as well as those defined by imported modules.
Likewise, we can recursively drill down the DOM from the application root component — calling ng.probe on each HTML element we find and filtering for ones that have a componentInstance - to build up a picture of each of the Angular components we find along the way. Again, Augury already does something similar:
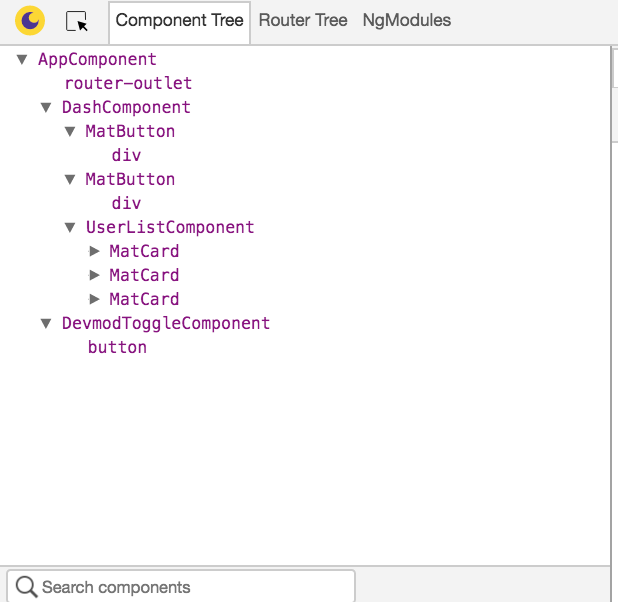 Augury’s view of the Angular component tree — built up from inspecting all elements in the dom.
You can see why it is definitely a good idea to enable production mode on your app before pushing it live to production. Not only can we do some interesting reverse engineering work but XSS could do some pretty malicious things by replacing providers used by the injector in your app.
Enter: DevMod
At the moment, we’ve got half the story — the debugging functions provided by Angular. What about @DeveloperFunction and the other decorators provided by DevMod? Well, those are actually pretty straight forward decorators with nothing special about them. All they do is set some metadata on your component class (previously using Reflect) about what functions are available for debugging.
So now we have a full list of all the Angular components in the DOM, we have a list of all your services, and each service or component might have some DEVELOPER_FUNCTION metadata on it, we can make a simple interface to show all the components that have developer functions on them and list each of the developer functions as a button that calls the method on the component instance.
Of course, we dressed up the styles a bit and added a few nifty built-in functions, but this pretty much forms the core functionality of how DevMod does what it does. Ever since, we’ve never had to fill in a form again — and now you don’t either!
 DevMod being awesome
- Date: May 28, 2018
- Categories: blog, apps, errors, development