Swift and Objective C both use Automatic Reference Counting (ARC) to keep track of when an object is required to persist in memory, and when it can safely be released.
Memory leaks are when an object is created and kept in memory, but is no longer owned by anything and never able to be released. Often this is a cyclic dependency where object A owns object B, and B owns object A. They will both persist in memory as they are required by each other, but nothing else. By ‘owns’, we mean ‘holds a strong reference to’.
Leaks are commonly seen in the delegate pattern. Delegate references should always be declared as weak, as a weak reference will allow the runtime to free up the memory. Thinking in a parent/child relationship, the parent should have a strong reference to the child, but the child should have a weak reference to it’s parent. In swift, references are strong by default.
Another common place for leaks are within closures. Any variables, including self, used within a closure will be strongly captured to ensure they still exist when the closure executes. To avoid a retain cycle here, use a capture list to tell the closure to keep a weak reference.
Note that this need not apply to all closures, just those that are @escaping, which means they will be stored to be executed later. John Sundell has an excellent post on this called Capturing objects in Swift closures.
Eg:
object.run { res -> Void in
	self.result = res
}
Will leak self.
Fix this with weak or unowned as appropriate in a capture list:
object.run { [weak self] res -> Void in
	self?.result = res
}
Debugging Using Console Logs
This somewhat rudimentary method involves logging. Start by placing a print statement in the init method of the class you are checking. I like to use emoji to make it easy to see in the console.
init() {
    print("✅ init my class")
    ...
}
And place another print statement in the deinit method.
deinit {
    print("❌ deinit my class")
}
Now run the app, and use the feature that allocates the class, then finish it so the class is deallocated (eg present a view controller, then dismiss it). You should see a balanced number of logs, eg one deinit for each init. If you don’t see the deinit log then your object is probably being leaked.
Instead of logs you could use breakpoints, and for bonus points play a ‘pop’ sound when deallocation occurs.
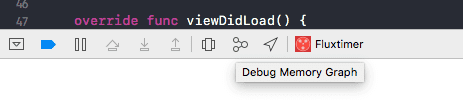
Debugging Using the Memory Graph Tool
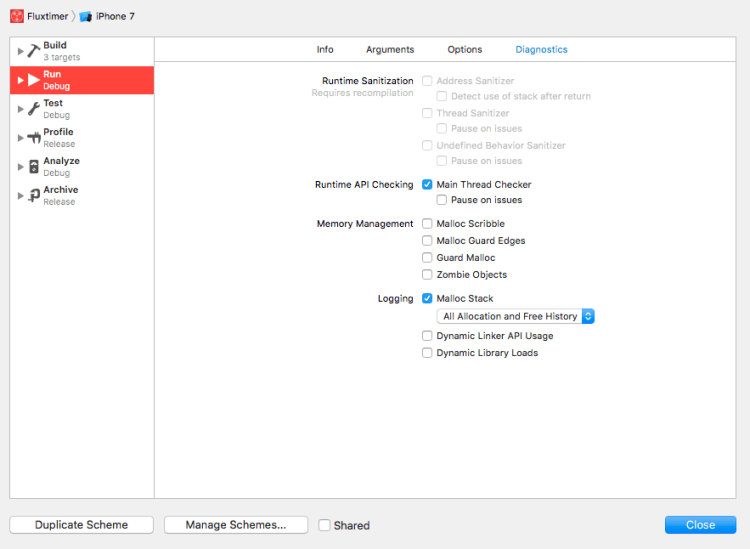
This is a runtime tool available in Xcode when you are debugging in the simulator. To start with, edit your scheme and enable Malloc Stack.
Next, run your project, and exercise the app to generate leaks. For example, if you suspect a certain view controller is leaking, present/push and dismiss/pop that view controller a bunch of times. Then launch the Memory Graph Tool.
If you have a leak, it may or may not be highighted automatically with a purlple bang, so treat this as a clue only.
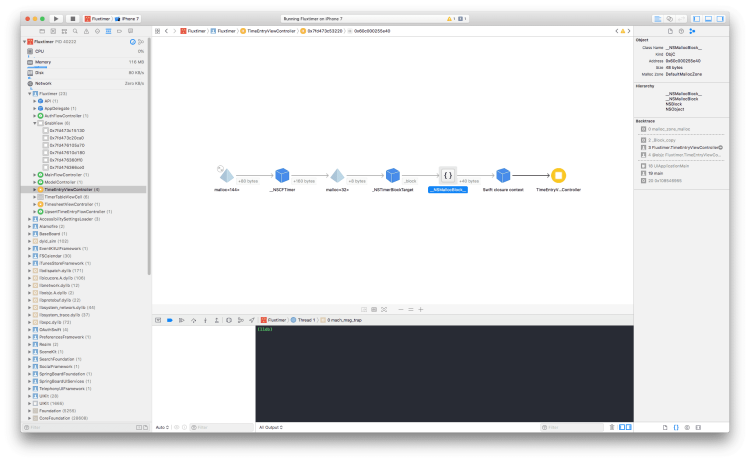
In the screenshot above we can see that TimeEntryViewController has (4) next to it, indicating that there are 4 instances floating in memory. Select one to see the chain of ownership leading to the cycle. If you are really lucky, like we are above, you will even get a useful stacktrace that when clicked will navigate directly to the line of code that captures the object.
Debugging Using Instruments
Xcode also provides an instrument tool for detecting leaks, which is a handy tool to have on the belt.
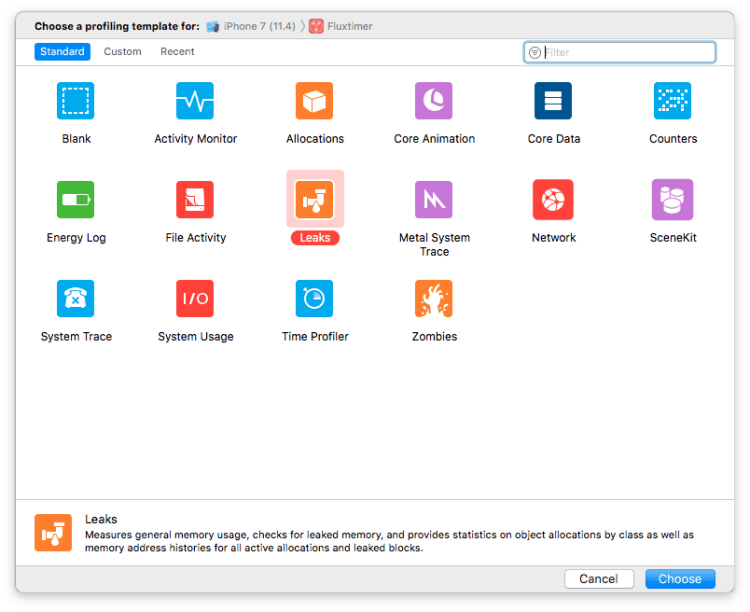
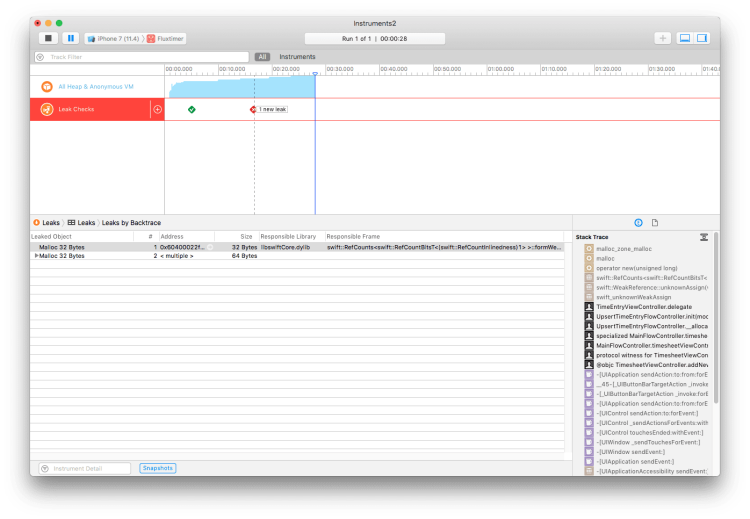
If you want to have a play, run Xcode -> Product -> Profile to start Instruments, then select the Leaks template. Once it loads, press the Record button to start the app in the simulator.
As the app is running, use it and observe the Leak Checks row, it will be marked with a red cross when a leak is detected. Click on it to see the Stack Trace.
Conclusion
As modern devices have significantly more RAM than the first iPhones, apps crashing due to excessive memory consumption is a rarer thing. Nonetheless, it’s always worthy of avoiding leaks, as they can often lead to other issues or bugs at runtime.
Hopefully this post will help you to plug up a few leaks in your app.
- Date: August 10, 2018
- Categories: blog, apps, swift, ios